
1. Introduction
As a Product Owner, Scrum Master or Developer member, you are probably familiar with a situation in which an important Stakeholder (read the person who sponsors/pays for the product) comes up with a simple question:
“When do you think you can deliver a certain increment so that we can release it…” The question is also supplemented with “ …and preferably with an exact date”.
Simple question, but difficult to answer in most cases, isn’t it?

Answering such a question is difficult because we cannot see into the future in a complex ecosystem in which our product exists. The first thing that comes to mind when I realize that I am not making a false promise is the following:
– Looking together at the created product roadmap
– Refer to my transparent Product backlog
– Invite him (my stakeholder) to the next Sprint Review.
Despite the above, I often notice that the important (complex) question is not answered and that is “on what date can I expect my (partial) product”.
Some time ago during my studies for PSK (Professional Scrum with Kanban), as a die hard Scrum enthusiast, I came into contact with the Kanban framework. While learning, I came into contact with a number of metrics that I think can help you “conservatively” predict when we can deliver increment(s).
I’ll leave the theory of kanban behind and refer you to the end of the article for more information and now jump into the world of kanban metrics.
2. Kanban Flow Metrics
The four-basic metrics of flow that Scrum Teams (using Kanban) will need to track, are as follows:
- Work in Progress.
- Cycle Time.
- Work Item Age.
- Throughput.
2.1 Work in Progress
Definition : Work in Progress can be defined as the total number of work items started but not finished (according to the Scrum Team’s definition of “Workflow”).
The team can use the WIP metric (in daily Sprints) to provide transparency into their progress towards reducing their WIP and improving their flow.
Example: The Team worked on Work items all day and the WIP has reduced from 10 to 6.
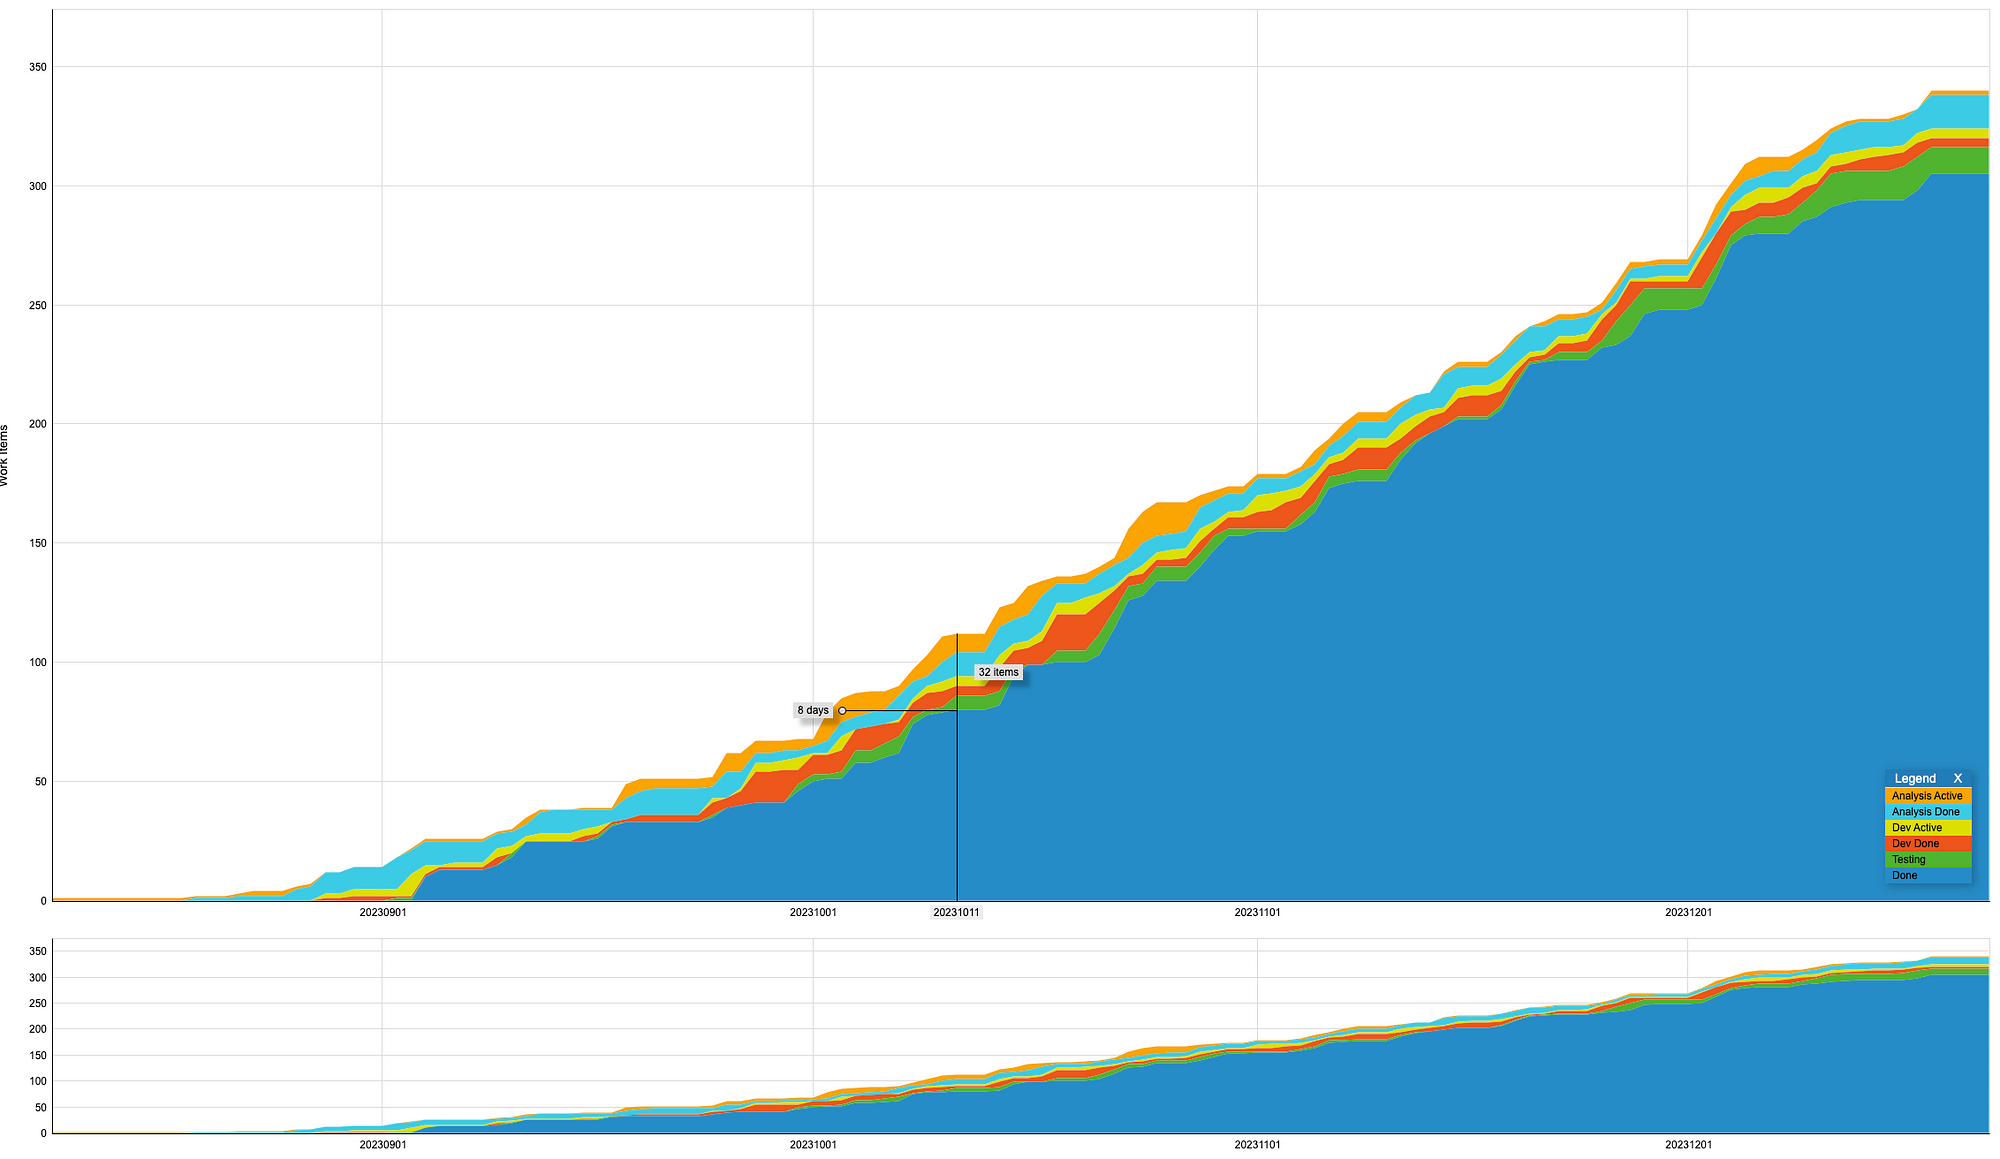
Cumulative Flow Diagram(CFD) shows the amount of work arriving, at various stages of in progress, and done. Most people use the Cumulative Flow Diagram to visualize the WIP.
Cumulative Flow Diagram (CFD) shows the amount of work arriving, at various stages.
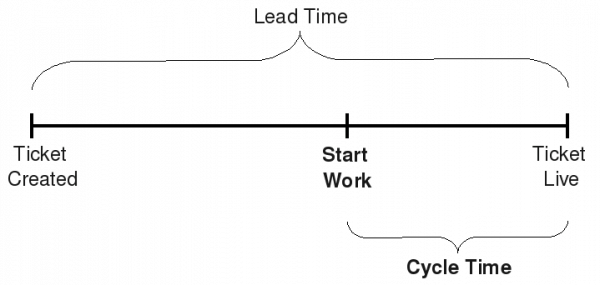
2.2 Cycle Time
Definition : Cycle Time: The amount of elapsed time between when a work item “starts” and when a work item “finishes.”
Cycle time is the amount of time it takes to complete one batch of work
and can be calculated only after the work item is actually finished (e.g. reached a Done lane on the Kanban board).
In the Cycle Time Scatterplot:
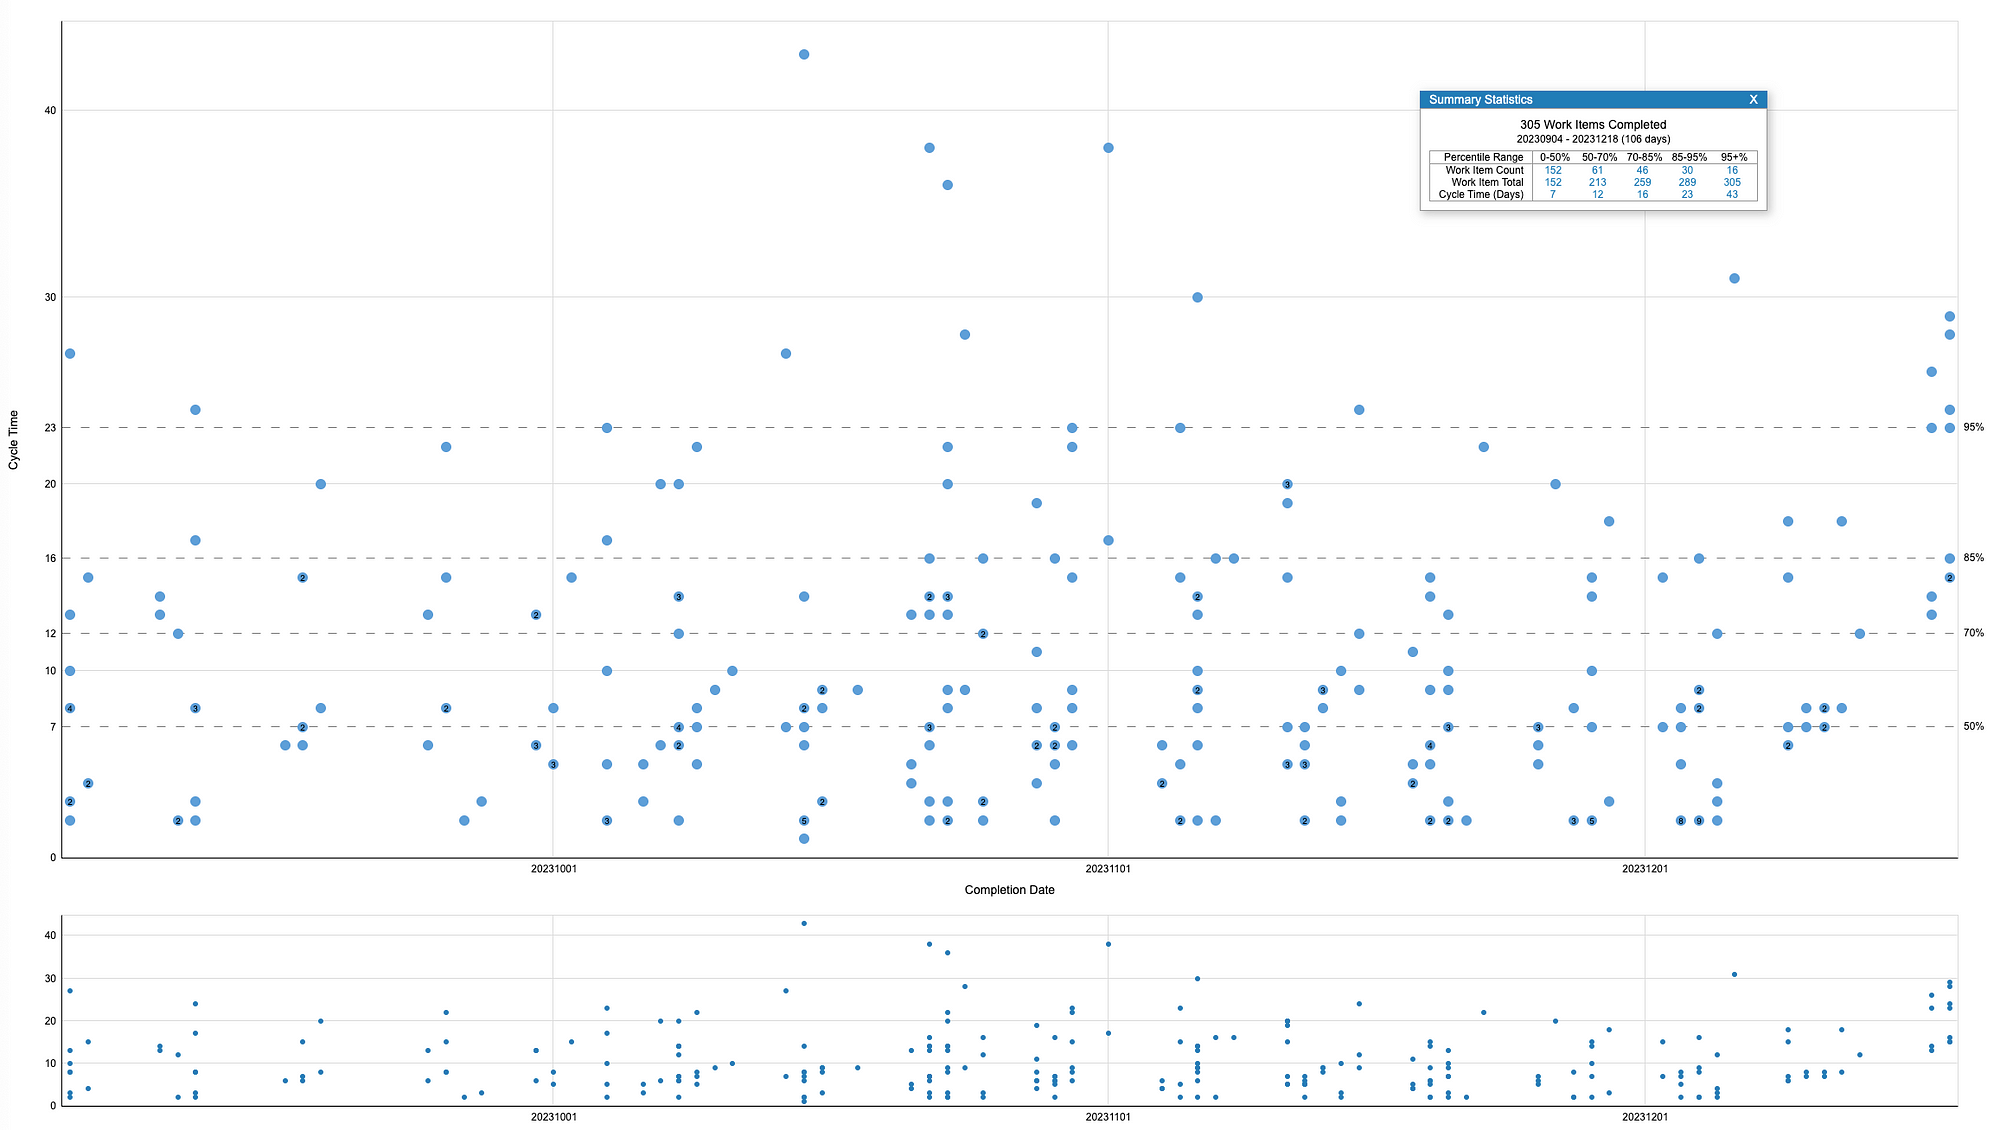
Explanation Diagram :
- The horizontal axis (X-Axis) of the chart visualizes a selected time frame by dates.
- The vertical axis (Y-Axis) represents the cycle time of the tasks that were completed during this period, calculated in days.
- Each dot that you see scattered across the chart is a marker representing a task within a card on your Kanban board. The positions of the dots are determined by the date of completion and how long it required for the Kanban card to reach the done column.
Benefits : One of the greatest benefits of using a cycle time scatter plot for Lean management is that it gives you the ability to forecast the outcome of future tasks.
Example : Let’s say that you’ve got 100 tasks that were completed in 50 days. If 50 of them were finished in 7 days or less, while all the others took longer, you’ve got 50 percent chance to finish any future task within 7 days.
The higher the percentile, the higher the chance to complete a future task within this time frame.
2.3 Work Item Age
Definition : Work Item Age is defined as the amount of elapsed time between when a work item “started”and the current time.
Work Item Age shows how long ago has each item has been pulled into WIP, on the Kanban Board.
It provides transparency to which items are flowing well and which are sort of “stuck” even if not formally blocked.
Aging Work in Progress chart gives us a lot of just-in-time data about how predictable Work items which are in-progress are. The “Aging Work in Progress” chart below provides information:
- To help identify specific items that are struggling and require attention.
- For each item on the Kanban board how long ago has it been pulled into WIP.
- The Stage active items are currently in the workflow
- What the typical cycle times for this team are, and based on that which items are indications of flow risks
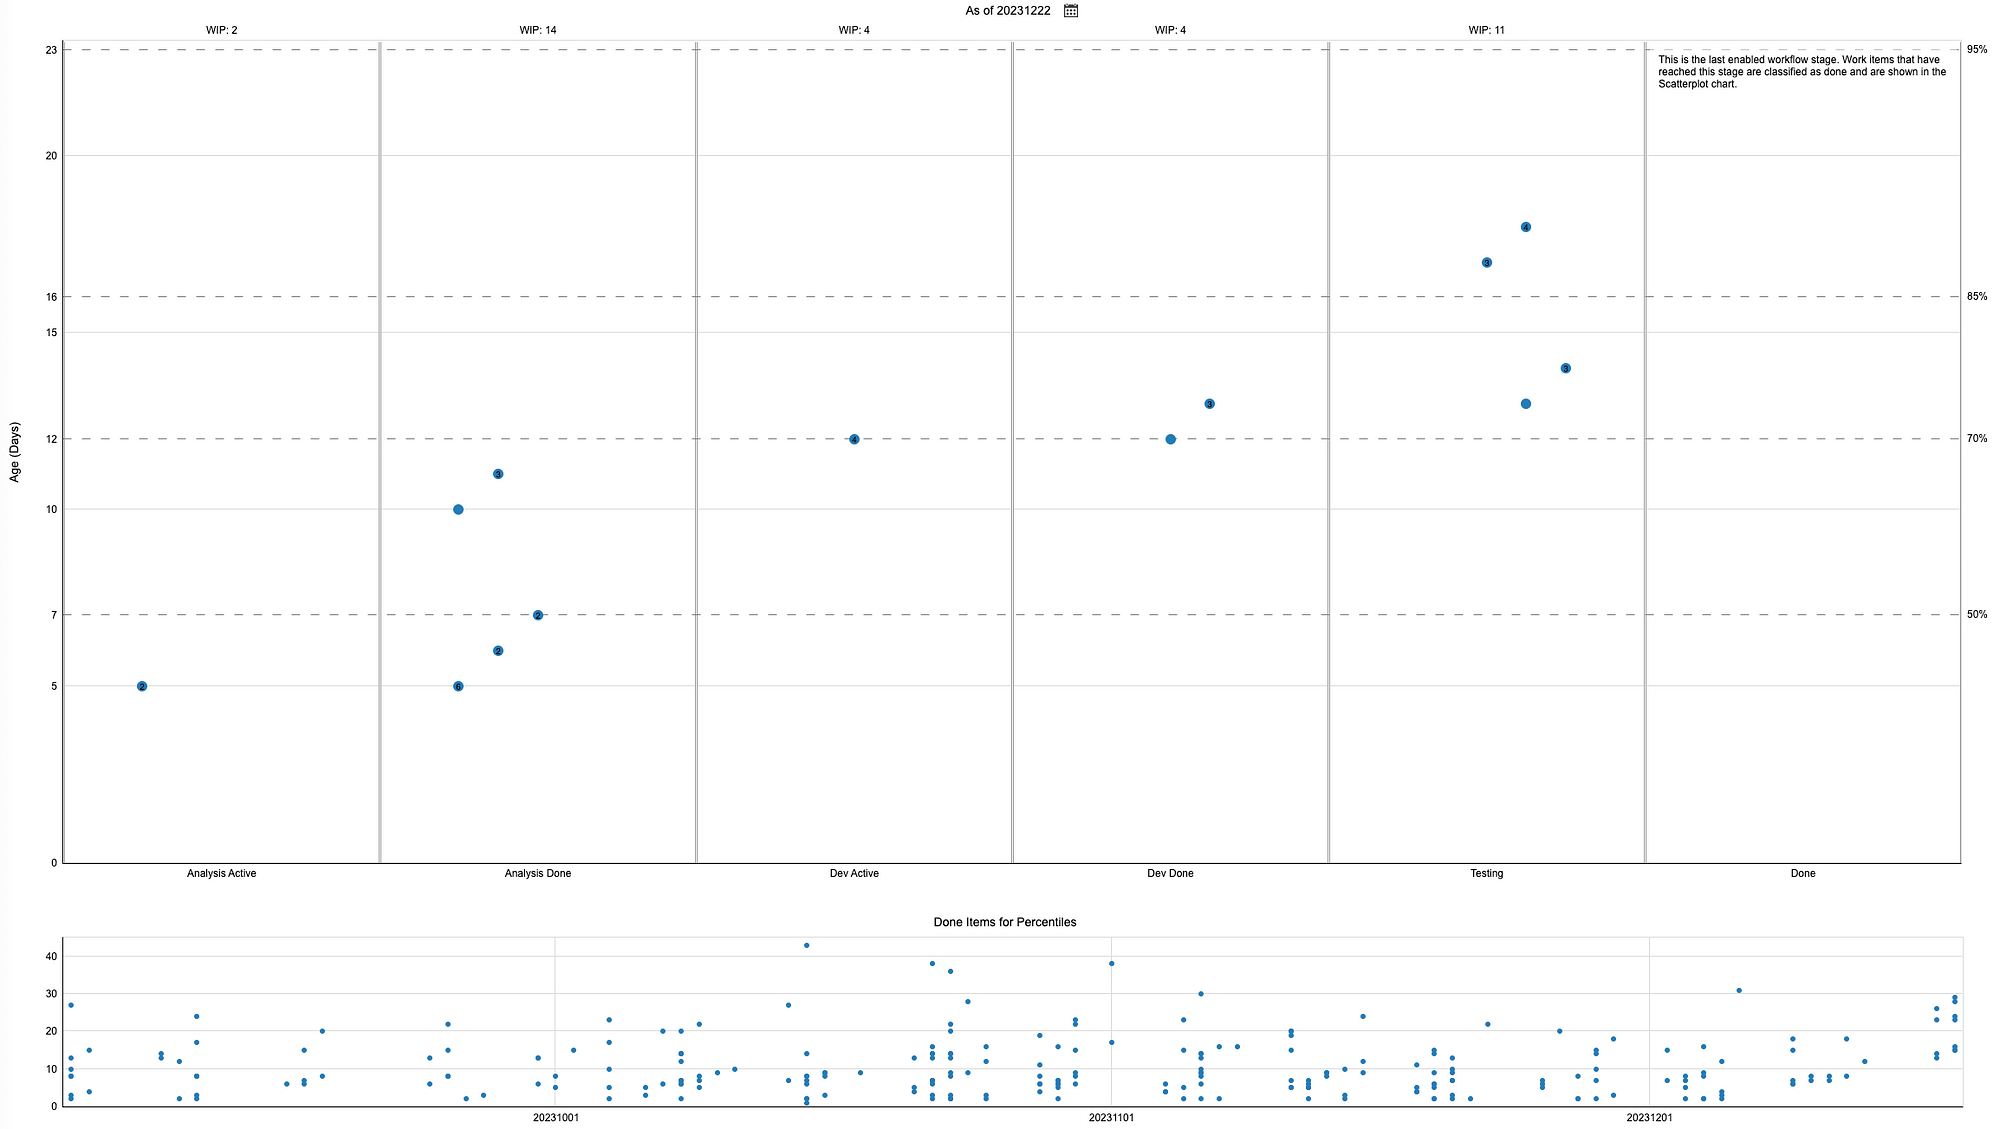
Explanation charts: x-as : Stages of the workflow; y-as : How long each task (dots in the chart) has spentin that section, in days; above : show how many task are in progress in every stage
Benefits :
- The data in the Aging Work in Progress chart lets you easily get an idea of how your team was performing in similar contexts in the past.
- The higher the task / dot, the longer the task will take to complete and the higher the chances of a delay.
- The Percentile lines that run alongside the vertical axis indicate the percentage of tasks that were previously completed.
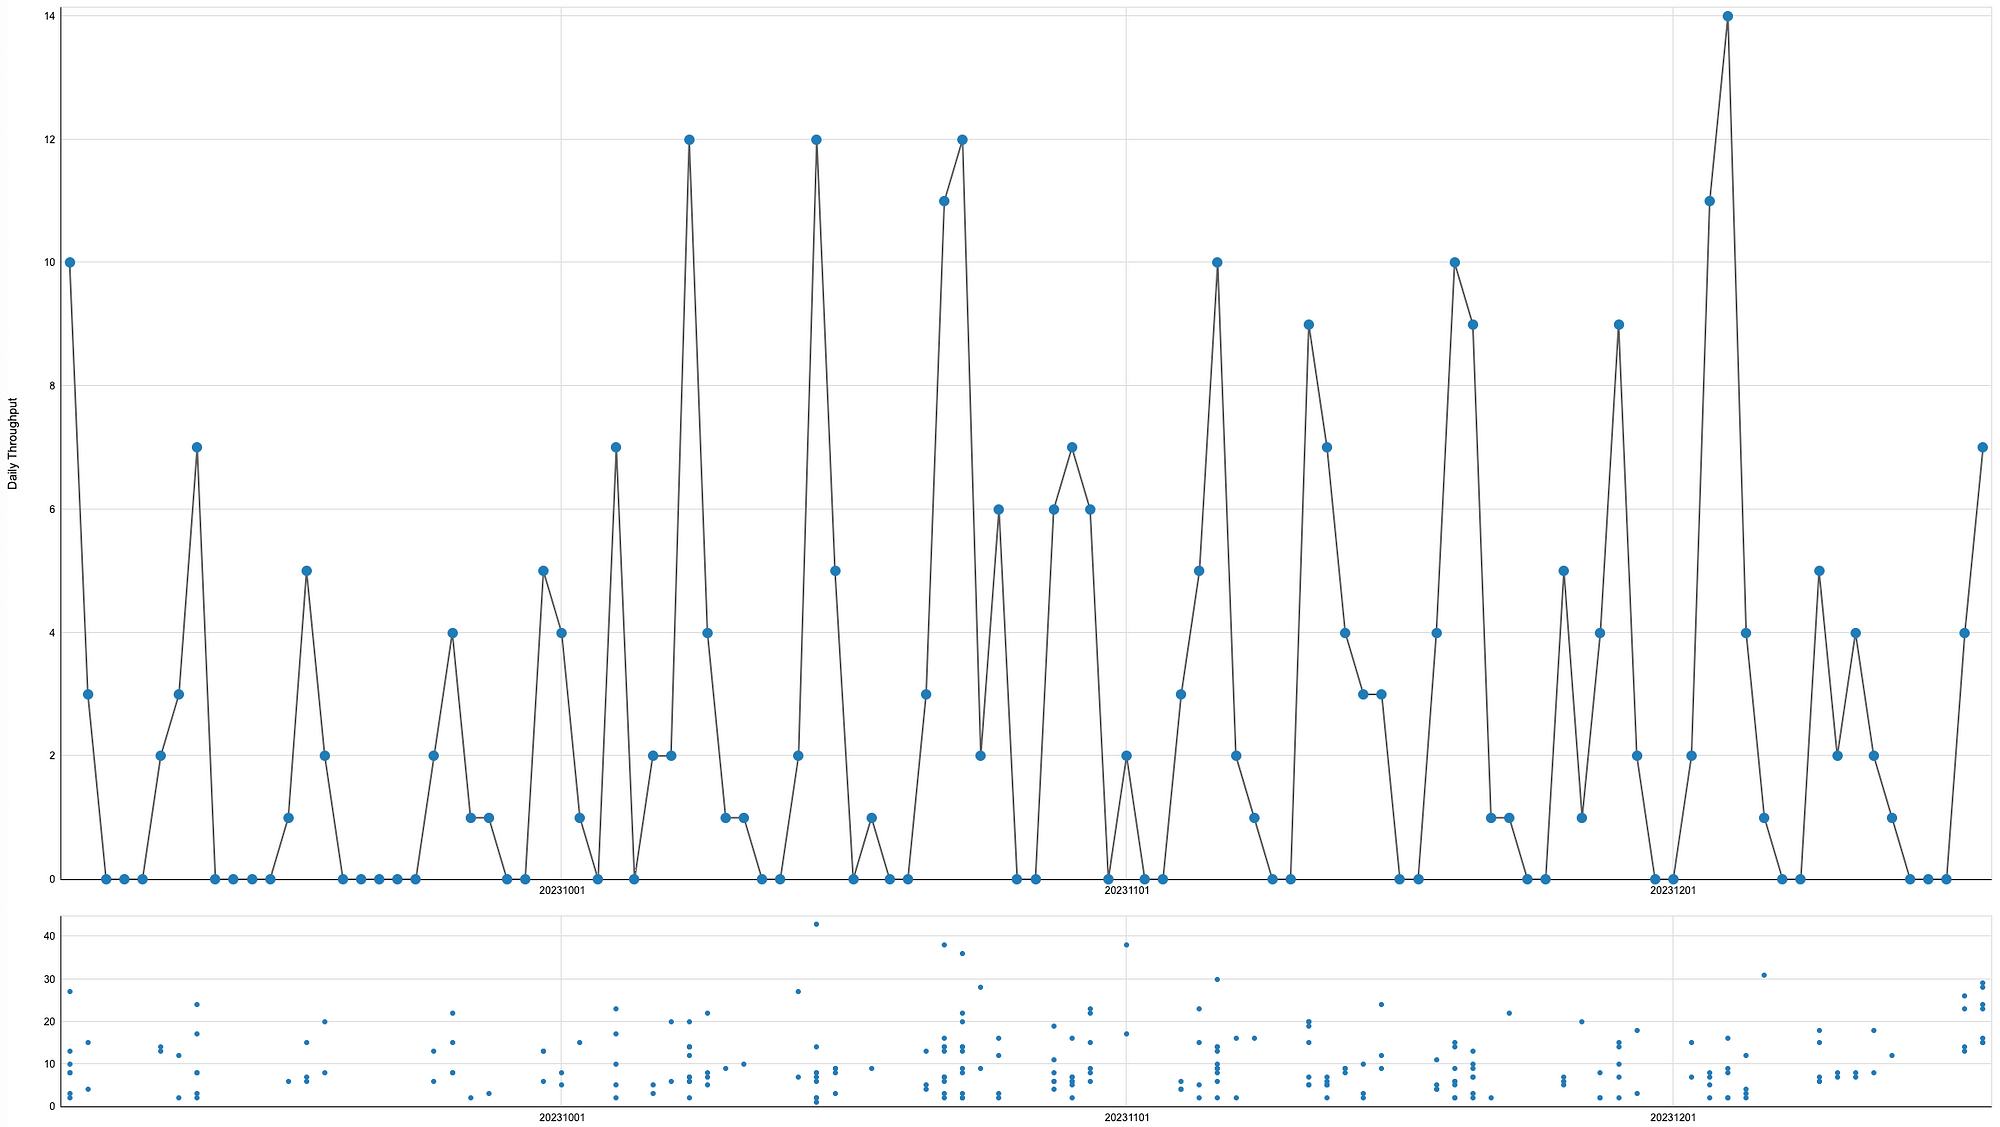
2.4 Throughput
Definition : Throughput can be defined as the number of work items “finished” per unit of time.
The measurement of throughput is the exact count of work items, without any compensation for item size.
Throughput is measured at a certain step in the workflow, typically at the finish line of the workflow.
Throughput can also be used as part of release or Sprint Planning/road-mapping discussions, especially when combined with Monte-Carlo simulations provide some better visibility/confidence into “What can be done by when?”.
3.0 Conclusion
The four flow metrics from the kanban framework can help you make some predictions when working with Product Backlog Items.
It plays a crucial role in helping teams assess and improve their processes. By measuring key aspects of work, teams can gain insights into their efficiency, identify areas for improvement, and make data-driven decisions.
Remember, the key is to adopt Kanban metrics gradually and experiment with what works best for your team within the Scrum framework. Regular feedback and adaptation are fundamental principles in both Scrum and Kanban, so use metrics to drive continuous improvement and enhance your team’s effectiveness.
Hopefully, with this article I have been able to help you understand what kanban metrics are and how you can best apply them.
4.0 References
- The Kanban Guide for Scrum Teams : www.scrum.org/scrum-kanban
- Demo environment Metrics Charts: https://demo.actionableagile.com
- Bye Bye Velocity! Kanban metrics as an alternative (Must see) youtu.be/3IEr9rKir08?si=qu_4WlkpXklUoogk
- The Home Of Kanban : https://prokanban.org
- Interesting resource : https://businessmap.io/kanban-resources/getting-started
- Flow Metrics for Scrum Teams : https://prokanban.org/wp-content/uploads/2022/08/flowmetricsforscrumteams.pdf